MONITOR FARM
Putting the FGA Strategic Hedging Model to Work
Changes Since Last Update
• Seeding finished and areas finalised.
• Production outlook remains average, with confidence lowered due to drier start.
• Barley market changed from bullish to neutral, with below average confidence.
• Canola market technical outlook increased bullish rating.
• Profit expectations for both crops increased
The Factors
1. Total Cost of Production is $620/ha
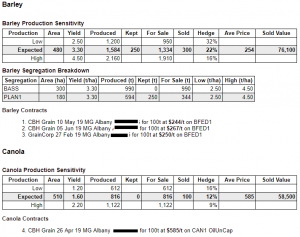
2. Production is currently estimated at 3.3t/ha (barley) and 1.6t/ha (canola)
3. Other market and confidence factors outlined below
The Objectives
1. $680,000 Cashflow by 31st December
2. Greater than 15% profit
3. Price protection @ 2.2t/ha (barley) & 1.2t/ha (canola)
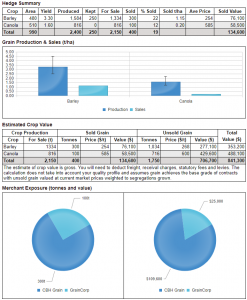
Since the last update on the 10th May, we’ve seen barley and canola prices rally. In the last few days, barley prices have come off with expectations of forecast rains, which triggered the sale of another 100t of barley.
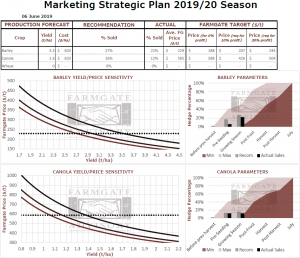
Current sales are sitting at 22% for barley and 12% for canola, both below the models recommendation of 27% and 16%, and will likely be revised once production confidence improves.
I’ll discuss the model and how it works throughout the season, as factors change and questions are asked. For now, see the output of it below based on the current production outlook, market deciles and outlook, time of season and profit expectations.
A couple more points to note
The model works on farmgate pricing, while the above report is actual contracted figure, which in this case is FIS Albany. Malt spreads are not factored into these prices, and BFED1 values will be used until harvest.
The model uses farmgate values as this frees up the grain to be marketed into all channels.
How to read it?
The sensitivity charts on the left side are showing how changes in yield/price influence net profit. The lowest of the curved lines is breakeven, the middle is 10% of gross revenue as net profit (before tax), and the top line is 30%. The dotted horizontal line shows current average price (represented at a farmgate level). These profit levels correspond to the targets to the right of the table, based off the yield estimates to the left.
The ‘recommendation’ column is showing the current recommendation as to how much should be sold based on the time of year, production outlook, market decile, market outlook, and profit as a percentage of revenue.
This then corresponds to the charts on the right showing the recommendation as a grey bar, and how that fits within minimum and maximum hedging ranges throughout the season.