Putting the FGA Strategic Hedging Model to Work
The Factors
Total Cost of Production is $620/ha
Production is currently estimated at 3.3t/ha (barley) and 1.6t/ha (canola)
Other market and confidence factors outlined below
The Objectives
$680,000 Cashflow by 31st December
Greater than 15% profit
Price protection @ 2.2t/ha (barley) & 1.2t/ha (canola)
Feedback after harvest from a client indicated that he wanted Farmgate Advisory to take full control over his businesses grain marketing.
I’ve decided to share this process with you, which I’m calling ’Monitor Farm’, with the objective of adding value to your own grain marketing decision making.
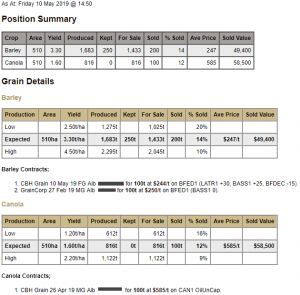
The business is mixed enterprise, with 510ha of barley and canola each (no wheat unfortunately). 250t of barley will be kept for seed and feed.
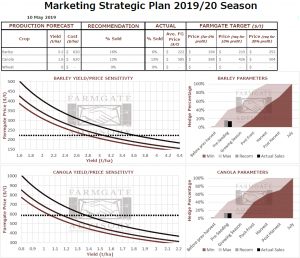
Using our marketing model to structure strategy throughout the season, we have made the following sales.
I’ll discuss the model and how it works throughout the season, as factors change and questions are asked. For now, see the output of it below based on the current production outlook, market deciles and outlook, time of season and profit expectations.
A couple more points to note
The model works on farmgate pricing, while the above report is actual contracted figure, which in this case is FIS Albany. Malt spreads are not factored into these prices, and BFED1 values will be used until harvest.
How to read it?
The sensitivity charts on the left side are showing how changes in yield/price influence net profit. The lowest of the curved lines is breakeven, the middle is 10% profit, and the top line is 30%. The dotted horizontal line shows current average price (represented at a farmgate level). These profit levels correspond to the targets to the right of the table, based off the yield estimates to the left.
The ‘recommendation’ column is showing the current recommendation as to how much should be sold based on the time of year, production outlook, market decile, market outlook, and profit as a percentage of revenue.
This then corresponds to the charts on the right showing the recommendation as a grey bar, and how that fits within minimum and maximum hedging ranges throughout the season.